If you were one of the foundation professionals who joined us this year in Nashville, you are hopefully well into your planning for how to put some of what you learned to use; I’m also hoping you enjoy this little refresher on what I consider to be some of the finer takeaways from our foundations track.
bbcon 2019 last month in Music City was the biggest and best one yet, breaking the record with over 3,000 attendees from close to 1,700 unique organizations. If you were unable to join us last month, we hope that you’ll join us next year at bbcon 2020 in Seattle.
In this post, I’ll highlight four of the key takeaways attendees identified by our attendees as being the most critical to positioning their foundations for greater impact in 2020.
bbcon Takeaway #1: Small investments in data quality will yield big returns
In his session “You Make Me Wanna De-Dupe – How to Find, Eliminate, and Prevent Duplicate Records,” Mitch Hollberg of the Community Foundation for Greater Atlanta identified four productivity-draining issues that arise when your Foundation’s data is riddled with duplicate records:
- Money wasted – You can spend as much as 2x spend on marketing, postage, etc. sending out duplicate communications to the same stakeholders – and sending to non-existent stakeholders.
- Distortive results – an average revenue per “user” figures are inaccurate, due to inflated “user” counts.
- Morale suffers – poor data quality leads to a downward spiral: staff members lose confidence in the integrity of the data, who then take less care in the data they enter, and may even revert back to basic spreadsheets and other archaic data management methods.
- Relationship-ending – sometimes horrific mistakes – One record notes a spouse is deceased, while a duplicate record includes the spouse in a “Happy Birthday” email greeting.
Community Foundation of Greater Atlanta is a relatively small organization, with 46 employees, $1B AUM, and they issued $128 million in grants to over 2,700 NPOs in 2018. But after analyzing the organization’s database, Mitch and his team found over 1,000 records with at least 1 exact matching name, and over 2,500 pairs (5,000 records) with “Similarity Scores” of 95% or higher.
The team launched a 3-step Deduplication Project, to a) shrink the haystack – isolating records that are most likely to be dupes, b) Review & Validate – confirming records as a ‘dupe’ or ‘not a dupe,’ and c) Merge & Purge – creating a much cleaner file.
Here are some Duplicate-Record Review Best Practices:
- Duplicate review is BORING. Set up “Review Parties” to make it a social undertaking – but be sure to train your team to use common naming conventions.
- Technology can help – “Fuzzy Look-up” is an add-in for Excel, and is available free from Microsoft.
- If records are confirmed duplicates, have reviewers specify which record has the most complete information – this will be the “go-forward” record.
- Before enlisting the extended team, do a first pass review to resolve obvious false-positives (Ex: “Auburn United Methodist” vs. “Asbury United Methodist” have 91% similarity score but are clearly not dupes).
I think you’ll agree once it’s complete that a deduplication project is a very worthwhile investment in time, money, and staff morale-boosting. December is often a great time to take this on so that you can start the new year with a fresh database.
Good luck!
bbcon Takeaway #2: Well-planned and executed campaigns can make a HUGE difference
As Amy Lovell and Keralee Clay from the Amarillo Area Foundation shared with us in their session, “Building Community with Your #GivingTuesday Campaign”, after raising $172,000 from 55 nonprofits in 2017, they raised the bar way up for 2018 with a goal of $500,000.
But what would they do to achieve this 291% increase?
Four key steps they took in attaining this goal were:
- Getting their board to approve a $100,000 “amplification” investment to get the word out in their extended community
- Engaging corporate sponsors
- Engaging small and rural nonprofits to participate, and
- Researching how others had succeeded at #GivingTuesday
They realized the power of collaboration with other organizations – both nonprofit and for-profit – in their geographical area was the answer; they hoped that by overcoming a sense of competition around #GivingTuesday and instead working together with these other organizations for the better, they would achieve the success and their ambitious goal – and they were right!
In addition to the above, they also…
- Worked hard to unite their local media and the corporate sponsors they recruited towards a common purpose – including some local banks and TV stations getting involved.
- Conducted live group trainings where other nonprofits in the area came to be empowered on how to succeed at #GivingTuesday.
- Continued to consult with the #GivingTuesday.org staff
- Hosted campaign launch and wrap-up parties, engaging the larger community, and
- Invested in a peer-to-peer giving solution, making it super easy for people to donate.
One big inspiration for Amy and Keralee was a quote from a book that was actually introduced to them at bbcon 2018, New Power: How Power Works in Our Hyperconnected World—and How to Make It Work for You, by authors Jeremy Heimans & Henry Timms
“The right recipe for building an effective group is making people feel
like they are part of it and that they can stand out in it.”
The end result?
$865,120 raised (173% of goal) – via 1,300 gifts, from 22 states, 108 nonprofit organizations participating, and 15 sponsors contributing $213,000.
Moral of the story? Never doubt the power of a well-planned and executed campaign!
bbcon Takeaway #3: Impact measurement must be baked into the culture of your foundation
What is impact, and why does it matter? Because the world of philanthropy is transforming; impact measurement is your organization’s ability to track, report, and – most importantly –
leverage the results. Measuring impact is equally important to both the grantor and the grantee.
Alexis Fish, Senior Business Analyst at Blackbaud, and Aaron Larkin, Product Manager for Blackbaud Volunteer Solutions delivered their bbcon session “Measuring Impact at Every Level” to an overflowing room of foundations and fundraising professionals. They explained how nonprofit organizations these days need to make sure they are utilizing scarce resources to truly reach their goals, and that they’re generally good at reporting activities and stories of success. For instance, they often have data to demonstrate the work they are doing: children educated, animals saved, meals served, etc.
This data is helpful, but simply reporting on the activities that grant funds support does not give the full picture. Yes, actions are being taken but what kind and how much of an impact are those actions having – and is it the desired impact? For example, what did the children learn? To share their impact, nonprofits need to truly understand not just the activities but the results of the activities.
An individual story is far more meaningful when it can be connected to a broader impact.
I’m guessing this type of scenario sounds familiar to many of you reading this.
Webster’s definition of impact is… a powerful or major influence or effect in individual participants, communities or sector. So, as you both report on the results of your grantmaking, and your grantees’ grant spending, ask yourself…
- What has changed in the lives of individuals, families, organizations, or the community as a result of this program?
- Has this program made a difference – or enough of a difference?
- How are the lives of program participants better, as a result of the program?
Example: 215 of the 500 women within our reach are now self-sufficient and supporting themselves and their families.
Understanding impact allows both funders and nonprofit organizations to…
- Align expectations
- Focus programs on results
- Drive internal and external stakeholders towards our missions, and
- Guide future decision making.
A good rule of thumb is to ask these questions on the front-end of your grantmaking gifts; in other words, do your grantees have the ability to answer these questions within their goals towards making an impact – and then report it back to you?
Alexis and Aaron also shared a chart that is extremely helpful for an organization outlining its desired vision & impact:
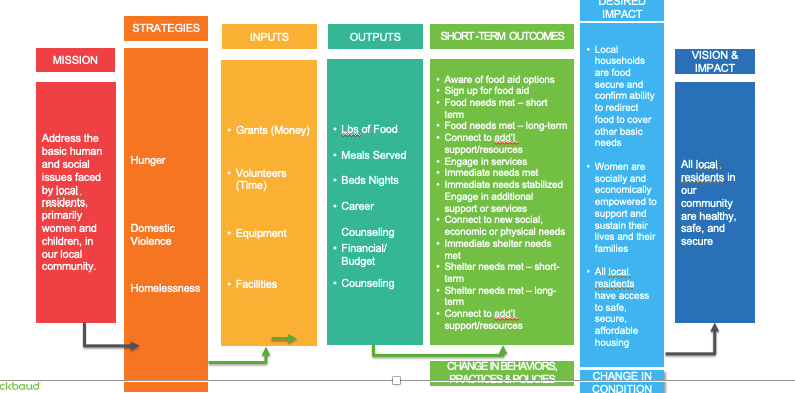
Takeaway Bonus: The secret is for organizations to effectively using this chart in your impact planning: Start with the headers and blank columns and fill it in – but from right to left!
bbcon Takeaway #4: What if you could “visualize” your grantmaking data?
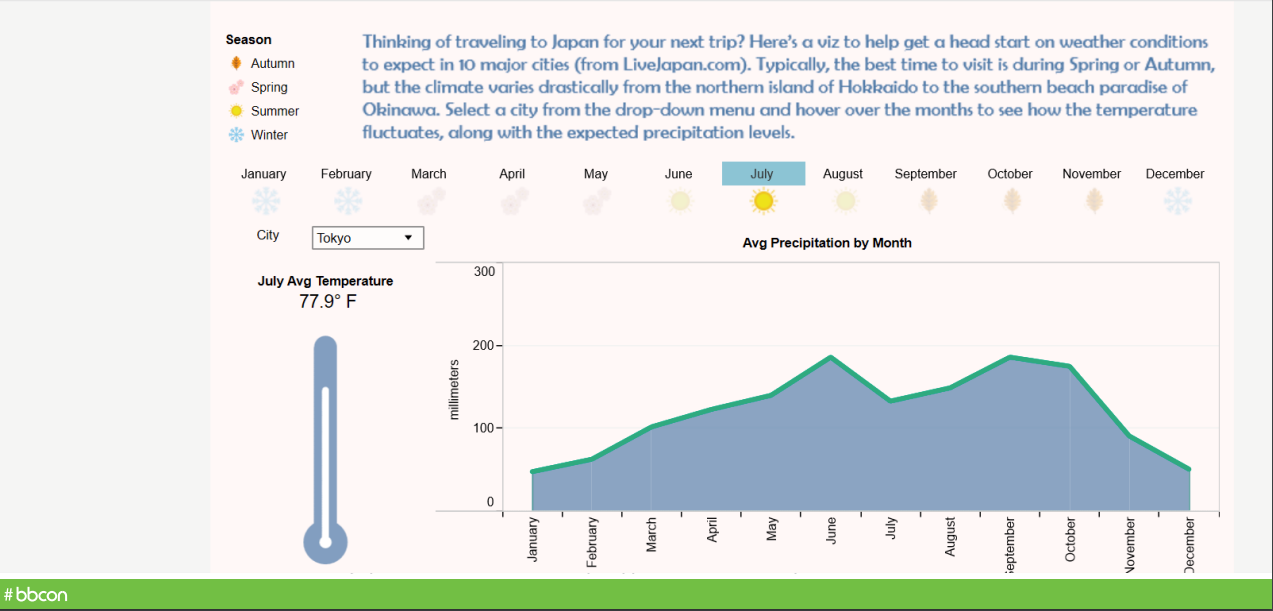
Natalie Smith and Matt Sharp of The Duke Endowment shared some unique information with our Foundations bbcon attendees: How they connected their grantmaking solution with a leading data visualization and business intelligence (BI) technology, to help their internal and external stakeholders make more and better data-informed decisions.
The internal demand for visualization originated when the grantmaking team sought an easier way to enhance their data, and felt – from what they knew about “data visualization” – that it would be the best way to show more, nuanced data in a way that would be easy to consume. Since the staff was highly focused on inputting more data around their awarded grant outcomes and impact, visualizing the data within their grantmaking solution was the key driver here.
Example of data visualization:
Once they chose a BI vendor, Duke also contracted with an experienced consulting vendor that built a web data connector (API) to connect their tried-and-true grantmaking solution with the BI tool. How does it work? The web data connector extracts data from the grantmaking solution, stores it in the cloud, and then converts it to be used within the BI tool.
So, after some trial and error in a “proof of concept” stage, the Duke Endowment team has now got their grantmaking data visualization exactly how they, well, visualized it.
Bottom line, data visualization can help your internal stakeholders understand the data better, and therefore help them communicate the outcomes and impact reflected in that data to your Board and your external stakeholders. We often talk about storytelling as a key piece of your communications in how you project your organization’s progress towards achieving your mission; visualization is just one more tool for doing just that.
In closing, at Blackbaud, we see these four takeaways playing a large role in 2020 and beyond. Explore additional resources around these topics on the Blackbaud Corporations & Foundations content hub, and seriously consider locking in your ticket to bbcon 2020 in Seattle now with discounted rates!
from npENGAGE https://ift.tt/2rmufIH
0 comments:
Post a Comment